
This is an old revision of the document!
Table of Contents
MLAB software development tasks
Distributed network measurement system
The network is intened for collection and distribution of measurements recorded on amateur volunteer stations. The resulting data are publicly available for analysis.
Considered data inputs (network nodes)
- Meteorological data from stations AWS01B
- Radio meteor detection stations RMDS01A - Radio Observer
- Video meteor detection stations VMDS01A
- Data reported by accidental observers - Meteor Observer
- Seismic / infrasonic measurements (meteor impacts, explosions, …)
- Radio telescopes
- Parallel observations from several astronomy sites
- Geomagnetic measurements
- SID monitors
- FRB monitors
- GRB monitors
- Network for lightning detection
- Measurement and coordination network nodes Automatických balónových sond
- Nodes acting as data storage, or performing some calculations on the data (data mining servers)
Each node as part of a network will be operated by the observational application (eg, radio-observer, Meteor Observer, Visual Observer, etc.) in cooperation with Station-supervisor which manages the station verify its work. Another daemon should therefore have an interface or file system in which data measuring application should store data and then solve optimal data distribution between data servers.
System Properties
- Measuring network should be able to send short informational messages with low data volume as alert of special events. For example, in the case of Fireball Network a bolide detection which is expected to impact to the earth. In this case we need to measure other data on the atmosphere, such as wind direction at different heights.
- The station should be configurable through a web interface on the central measuring project server. (Similary to Boinc BAM!)
- Central data data should have an API that would allow programming of other applications that use measured data (for live outputs in observatories and planetariums, or for educational purposes)
- An important parameter of the network is that data from individual stations were available at one time (with the least time scatter) in order to perform live calculations on the inter-station data.
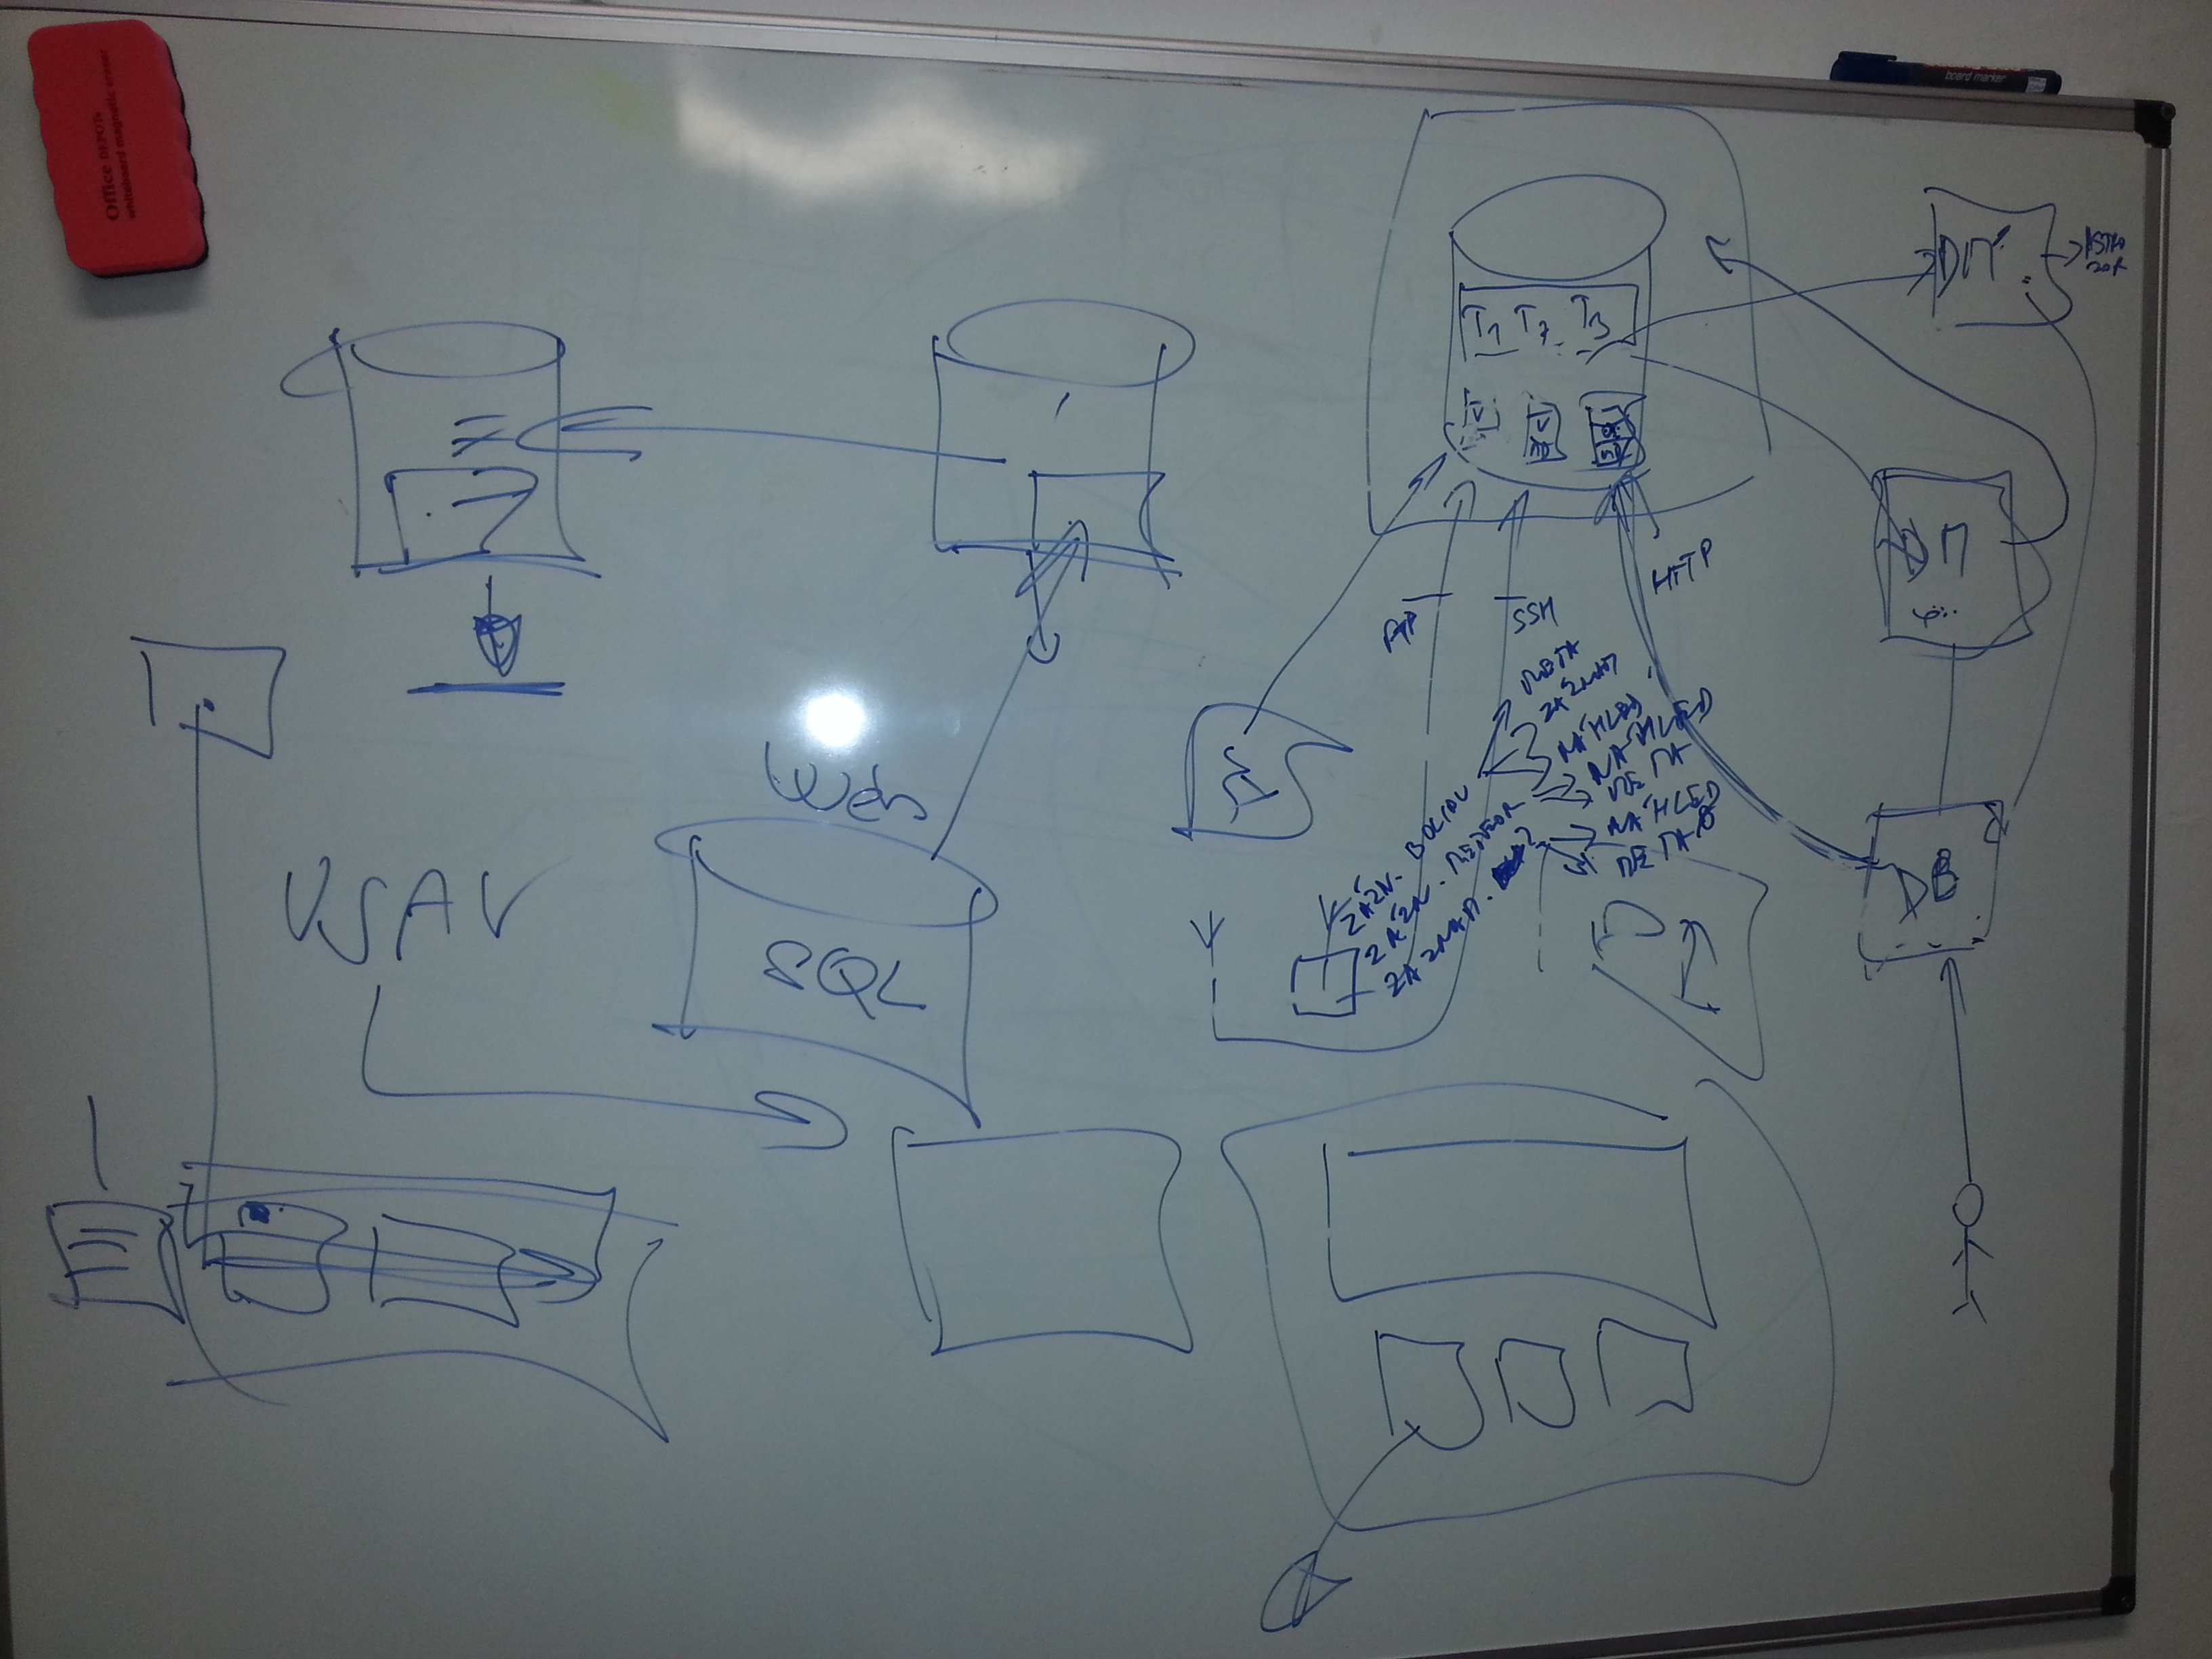
Typical station design
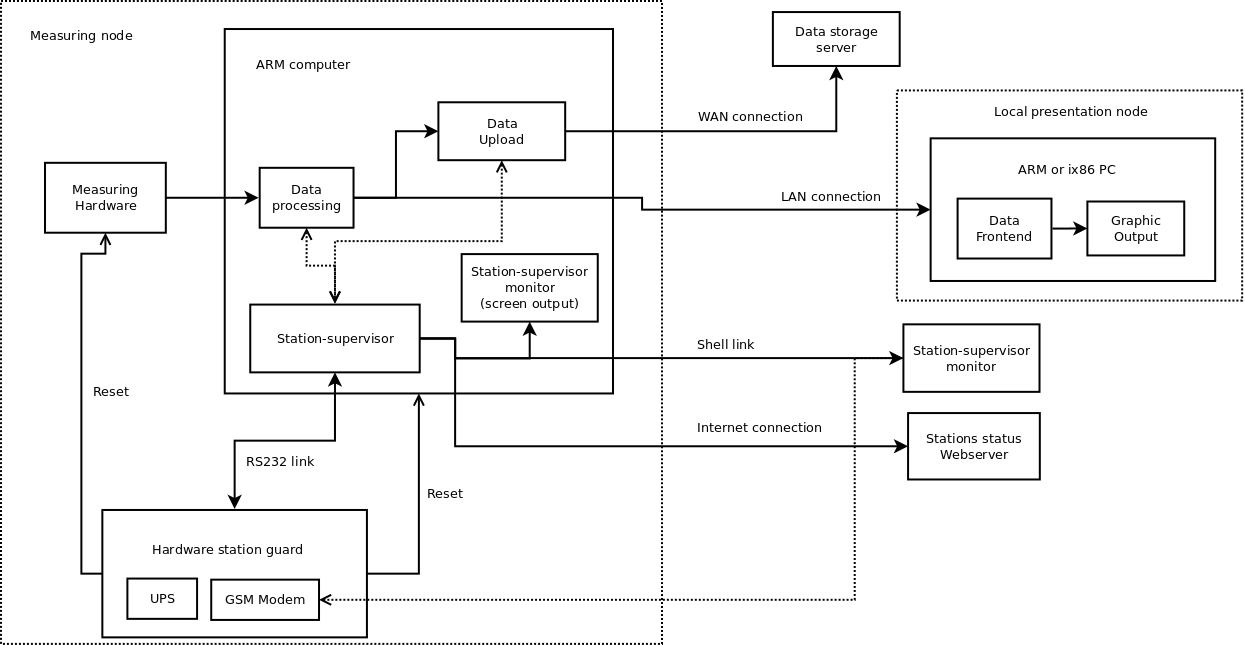
Image above illustrates an typical station connected to the distributed measurement system. The measuring station itself consist several subsystems.
Local presentation node
A PC system located at same site where the measuring station operates but generally in another room or building. The purpose of presentation node is displaying of measuring data in an interactive form which is attractive for visitors or should be used to demonstrate principle of measurement.
Measuring node
This is part which performs the measurement and it is responsible to data making. Measuring node has several minor subsystems.
Measuring Hardware - A set of sensors and hardware required for measuring.
Hardware station guard - A hardware recovery unit which could separately reset every hardware part of measuring node. The station-supervisor daemon should use this device for error outputs. Connection management between recovery unit and station-supervisor daemon will be self controlled by device. Interface between hardware recovery unit and main station computer should be terminal based. The terminal functionality should be provided by station-supervisor monitor software (ssmon) (if it is running, otherwise by standard system console) in system console mode station supervisor-should write debug output on this device (similarly to dmesg for example)
Network interface
We will not have direct IP connectivity from Internet to stations. Station supervisor software should generate data file outputs and upload these data files to an web server which serves station status information. Telemetry information will be displayed in the web on separate central web server. Web page served by central status server is primary diagnostic interface. Terminal interface to measuring node is secondary backup interface which is not accessible on all stations.
Moreover web access is intended as file based. File based means that station-supervisor uploads an diagnostic file to the central web server. Web server takes this files (from more than one station) and serve a web page with stations status information. User interface in this case is limited only to modification of an station-supervisor configuration file stored on web server.
For example configuration file may contain an parameter for station reboot request. After station-supervisor will notice a change or update in the web server stored configuration file, station-supervisor reboots the station and update its parameters according to actual configuration file.
Node software
Node hardware will run a data-processing utility (radio-observer for example), data uploading and distributing utility and station-supervisor daemon. Station-supervisor acts as watchman which checks proper functioning of whole measuring node. Data-upload is another daemon, which manages storage space on measuring node.
Station-supervisor does not have a screen output. Screen output may be served by client program ssmon (Station Supervisor Monitor) which generates interactive status screen after connection to Station Supervisor server.
Hardware implementation
Computing power
Measuring stations should be equipped with basic computing hardware architecture based on ARM specifically a multi-core ARM computer. The detection will take place at the stations already existing structures usually see the list of network nodes which will be connected to ARM computer.
Network connectivity
Parameters of network connectivity depends on the specific measurements ongoing at the station. The preferred option but will connection to ethernet. Alternatively wifi connection to the local network and then to the Internet. In some cases, remote stations and measurement that are not required large data flows can also consider using GSM network.
Time synchronization
Accuracy requirements for the station time again depends on the type of measurement. In the case of stations connected to the network via Ethernet, it is possible to use time synchronization based on NTP or PTP. Isolated stations with poor connectivity are then dependent on the use of GSNSS, as the time source. This issue is further elaborated on the page of time synchronization.
Software implementation
The network management would be advantageous to use the system to control robots ROS, or any system designed for control robotics telescopes. Similar functions are implemented in SNMP.
Data Processing
Generating secondary outputs
The measured data of the stations should be distributed to networks specialized for processing certain types of data. (RMOB for example). List of currently available specialized networks follows.
Meteorological data
In the case of meteorological data are available, for example the following networks:
Radio meteor observations
Data should be processed into colorgramm graph and forwarded to the network rmob. The current our version of software enabling the generation of appropriate outputs is or Githubu.
System stations administration
Registration of individual stations and user management should be implemented into the currently existing web interface project Astrozor.
Each station would then authenticate into the system with its private key. Which would be generated either by the server based on the user registration to the system, or directly to a user who would put his public key available to the network.
Measurement data storage and archive
The measured data are primarily backed by the station (on the data node). Each station will send data in to decentralized repository which includes a central cache server - this server will at all time contains most of the data available (or can only provide a link between the data storage node with archival data and user requesting the data), the server has not guaranteed availability at every moment. The primary purpose of a central cache server is to provide data access to other users on the Internet (HTTP), who are not members of the data network but need to download them for further processing or viewing.

The first step towards decentralized data storage will be the implementation of a centralized server which will receive station data directly (FTP, SSH / Rsync). With the gradual development of software tools enabling decentralization of data, data nodes will be added to which the station will be able to write.
Later the management of large volume of data will be handled exclusively in a distributed storage that will act also as part of the network. Data would therefore have redundancy based on division among multiple users, whose improve available data capacity and also data throughput. The data could then be exchanged between nodes by P2P technology, or other existing distributed data storage system.
Decentralized organization such storage solution would be to split the data into the repository with its asymmetric cipher. Metadata about the content repository (including checksums) would be signed with the private key, which would be owned by its author. The public key or its hash, would serve to uniquely identify the repository.
Data Visualization
Web Interface
Head echo meteor marking in the web browser. It should be done by clicking on the preview image generated by the server from recorded data. (It should marked as straight line across of Doppler shifted reflection. Marking Doppler reflection is needed in order to measure the time shift.).
Marking would be carried out by volunteers processors. Similarly, as in the project SETILive.
Radio records replaying
Live waterfall and audio output generated in HTML5 webpage. (Similar solution is GlobalTuners or WebSDR). This way of viewing would start after opening the RAW recording link of the detected radio signal.
Display of meteorological data
Record of the wind direction should be combined with the speed and displayed in 3D, as the deformation of the cylindrical surfaces.
A similar solution has a project display options time courses for visual analysis
FITS rendering
Ideally, Fits viewer would be a part of website and parameters could be set by scrolling bars in the browser. HTML5 would resolve data rendering. For example, setting the color palette, or composing of FITS to a film strip.
Existing Web browser FITS: jsFITS
The second possibility is to generate a preview by scripting on the server and erasing the oldest unused files (from the limited data space),
Local Data Viewer
It should contain a computationally intensive functions that can not be handled a web browser.
Viewing image based recordings
Visualization system for multi-station experiments, where it would be possible to view the recorded data from multiple stations at once. Several windows with different data sets which could be deployed to screens of the viewer's workplace. Each browser window as separate, but it would have tied the slider, like tools designed for comparing files.
Further improvement could be to use OpenGL for rendering textures of large images.
Current FITS viewers
- ds9
- qfitsview
- fits liberator
Multi parametric data viewers
A client application to download and special display data from measurement projects.
Known projects with a similar goal
Integrated SDR receiver
Astrozor
Adding support for users identification on observatories:
- The possibility of using an identification card
- Identify the user to the observatory on the basis of information about mobile phones IMEI, MAC IP, Bluetooth MAC (paired with bluetooth).
- A device mounted on observing site which would be capable to retrieve identification information.
Other suggestions and bugs are recorded directly on Astrozor
Meteograms for astronomers
Generating view of clouds in the sky from a particular observation point. Meteogram in the form of video could also display the time evolution of cloud.
For some cases,absolute concentration of moisture should be satisfactory. A movement or intensity of air masses of different densities, which then creates seeing. Computation should use NMM or WRF model.
The result of this calculation could be used for observation planning.
References
Implementation resources
Investigators
The project is implemented by a team of several students CTU, TU and members of Robozor robotics club:
- Bc. Marián Šuch - Visualization and preparation of the data distribution
- Martin Povišer - Signal digitalization and storage decentralization
- Bc. Jan Milík - radio detection of meteors
- Ing. Jakub Kákona - Organization and Architecture of the project
Founding
The project was supported by the ESA program of ESA Summer of Code 2013 and 2014.
Most hardware part of the project is realized from support of Universal Scientific Technologies s.r.o. 