
en:aws
Table of Contents
Automatic weather station AWS02A
An autonomous weather station with its own auto-diagnostics. The station is designed to work in remote areas together with other scientific instruments like robotic telescopes or other measurement stations.
Very common problems of such applications are scarce energy resources and a need for short-term data transmission occurring after long time intervals. As a result, a possibility of immediate failure report via short-band data channel is essential in order to minimize dropouts in data acquisition.
Apart from these technically still unsolved problems, there are other reasons to design such station - most notably an absence of serious OpenSource-hardware solution for meteorological data collection providing data for OpenWeatherMap network. 1)
Sensor construction
V této verzi stanice bylo ustoupeno od pokusů používat standardní komerční snímače vesměs uzpůsobené k vestavění do konkrétní proprietární meteostanice daného výrobce. Místo toho jsou navrhovány vlastní konstrukce snímačů a jejich zakrytování.
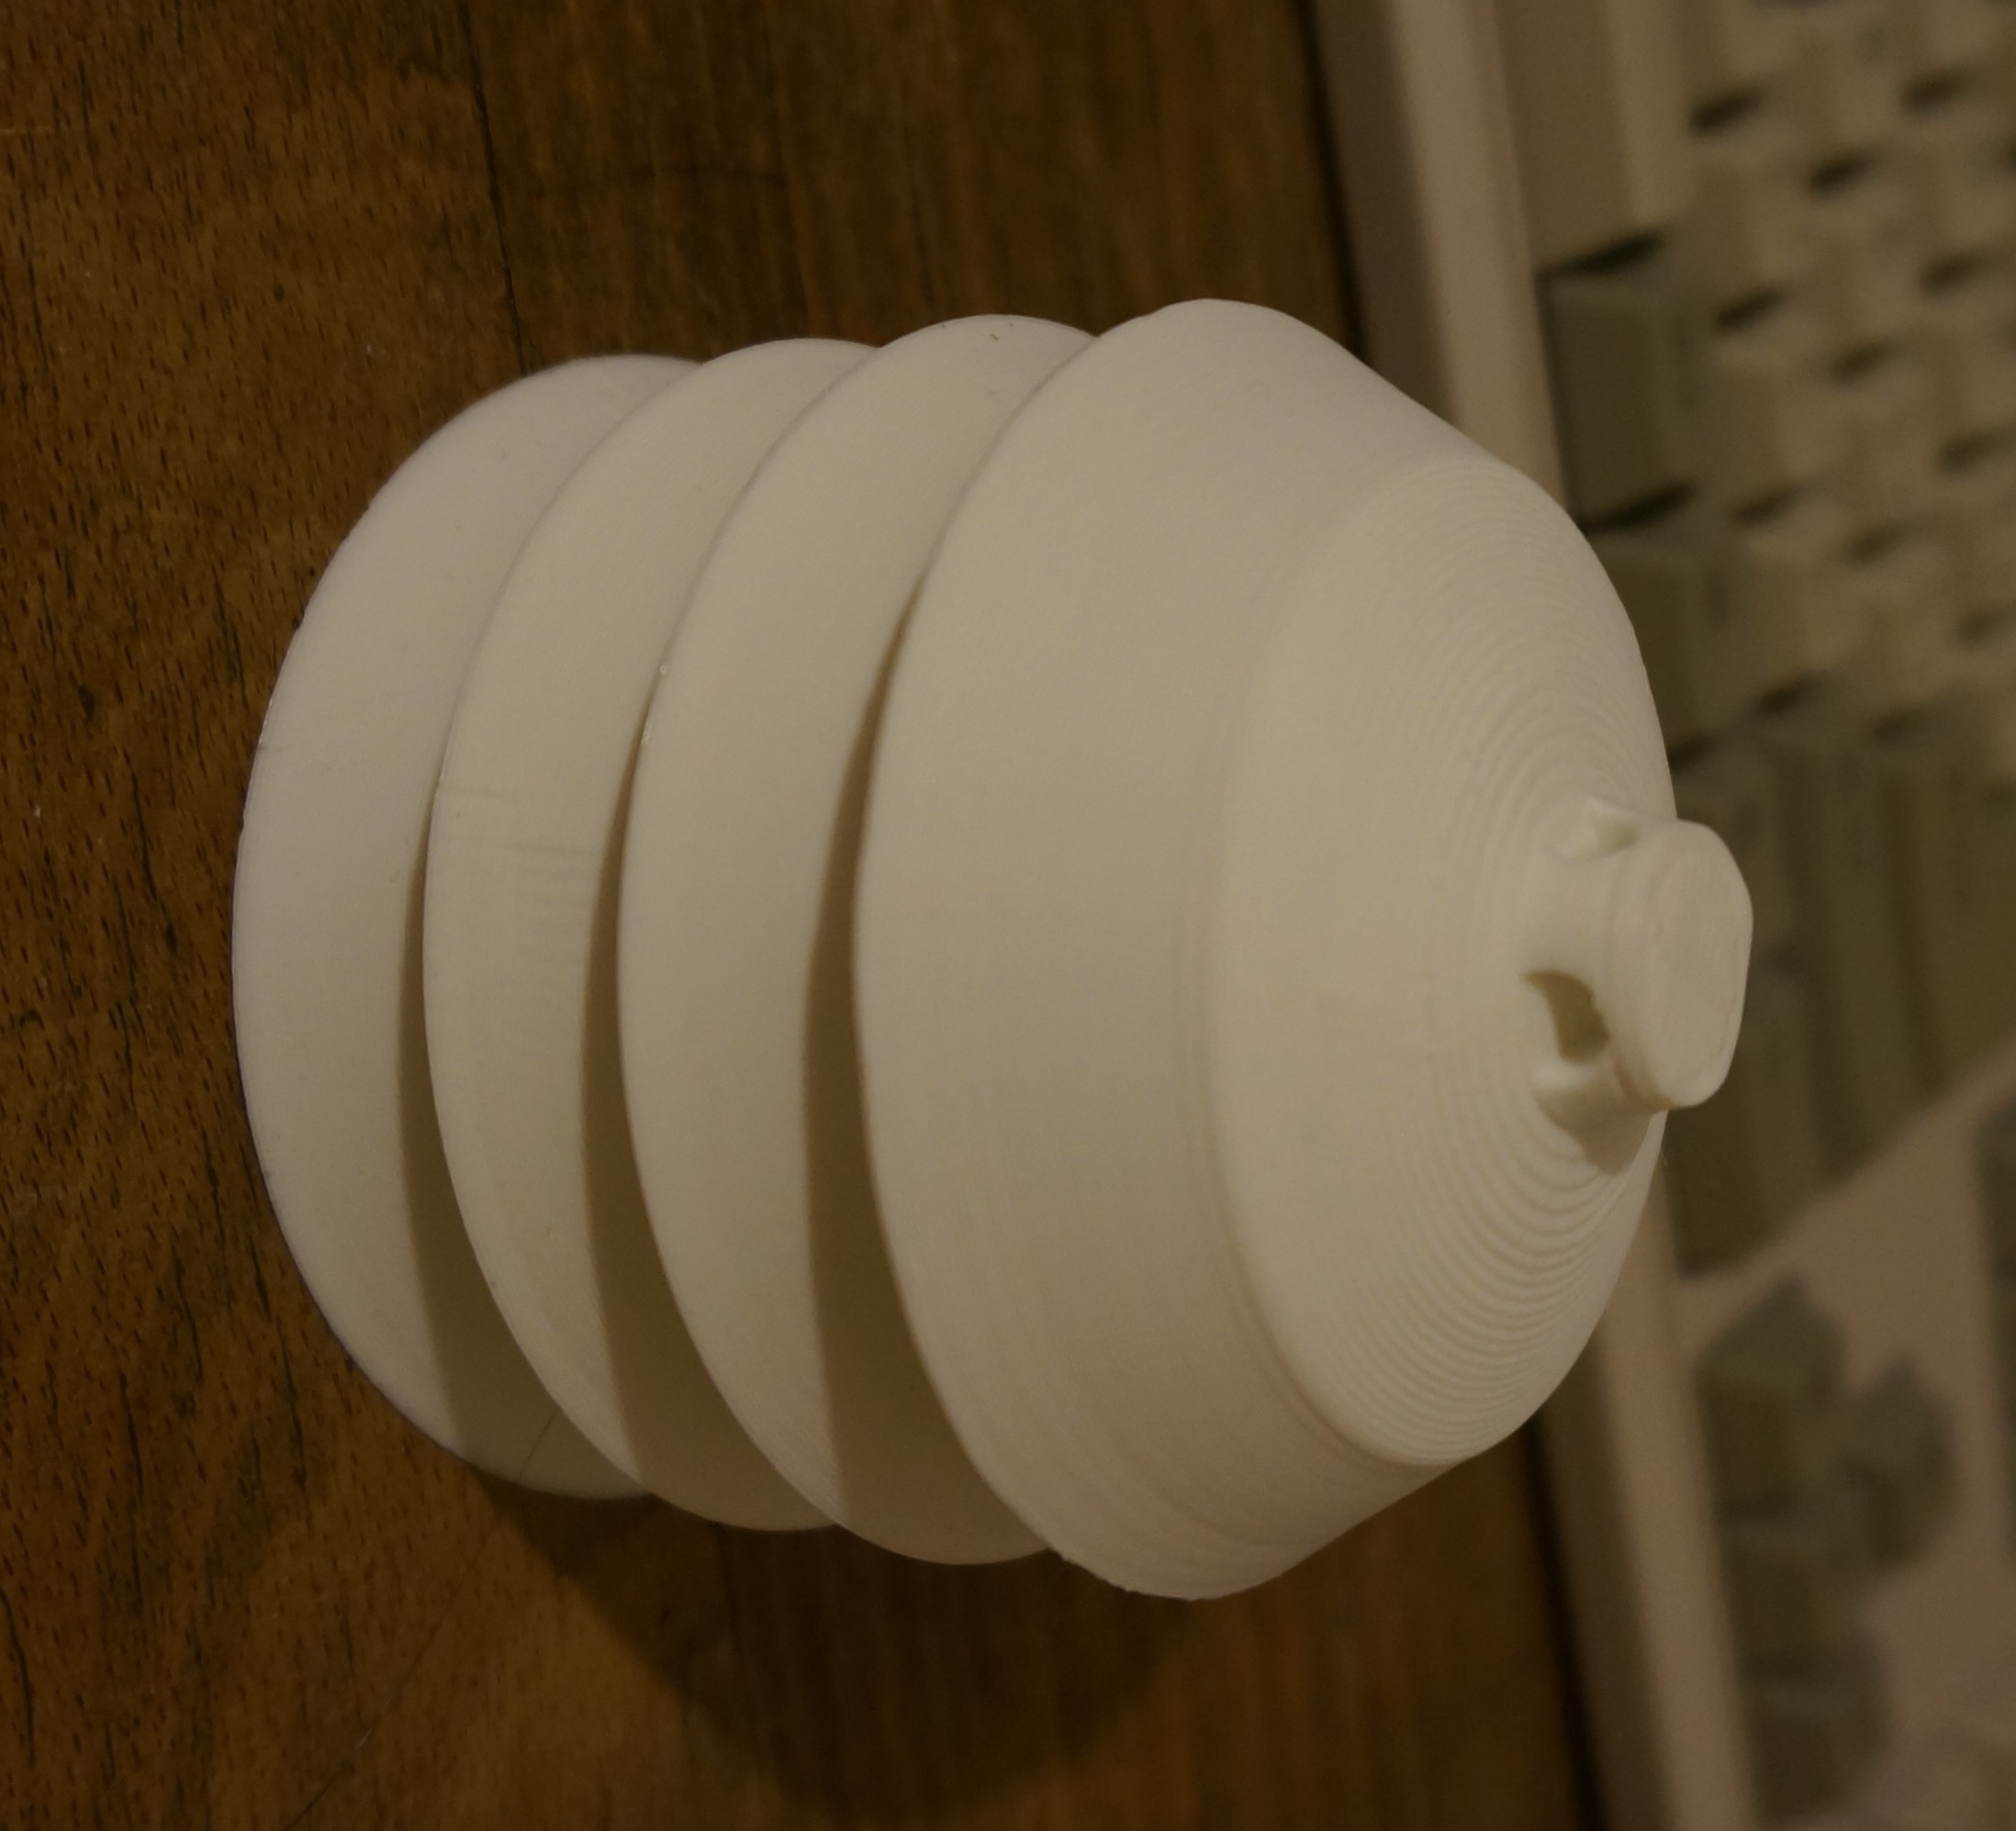
Stevenson Screen
Prvním navrženým snímačem je radiační štít tisknutelný na 3D tiskárně. Štít je navržen v programu OpenSCAD a jeho zdrojové soubory jsou v SVN repozitáři MLABu. Výtisk na následujících snímcích je z biodegradabilního materiálu PLA.

Ultrasound anemometer
Automatická meteostanice AWS01B
Tato konstrukce využívá meteorologická čidla ze stanice wh1080. Jejich vyčítání je řešeno Microchip PIC MCU. Od této konstrukce je postupně upouštěno z důvodu špatné dostupnosti náhradních mechanických dílů, jejich kvalitě a omezeným možnostem MCU. Ostatní kvalitní v této konstrukci ověřené snímače jsou však přeneseny do následující verze.
Sensors

Anemometer
A classic anemometer design with cup-shaped rotor.

The anemometer generates impulses with period inversely proportional to the wind speed. Easy reading via pulse counter and timer.
Wind speed measuring requirements are met with 1Hz sampling or upon the impulse arrival (in the case of very low wind speed or failure).
Common difficulties
- Mechanical degradation
- Freezing
- Limit to the mximum measured wind speed
- Seizing up 2)
Solvable by using other anemometer designs - e.g. sonic or ionization anemometer.
Wind direction

Weather vane with wind rose serves as the most basic wind detector. The position of the vane is read by a reed switch and it is recorded when it changes.
Common difficulties
Similar to anemometer.
- Mechanical degradation
- Freezing
Can be solved by using more sophisticated anemometer designs that measure vectors (for example ionization or sonic).
Precipitation
 A traditional tipping bucket rain gauge generates impulse upon tipping of the lever. As it does not occur very often, it is recommended to record the precise moment of tipping in order to assign the precipitation a more accurate position in time.
The rain gauge should be equipped with heating and temperature sensor for ice melting regulation.
Common difficulties
- Clogging, freezing
Snow precipitation
According to requirements of a weather station operator, a wide variety of snow parameters can be measured.
Height
 Snow cover can be measured by a rangefinder (ultrasonic mostly), which measures the distance from a defined height perpendicular to the ground. Another option is to use an optical triangulation sensor.
In the case of acustic measurement, ECHO01A construction design can be used.
Mechanical properties
Some of the snow's mechanical properties, like hardness and stiffness, can be estimated using the reflected signal of the ultrasonic rangefinder. Using the optical rangefinder, on the other hand, can reveal other properties like reflexivity of snow cover or its spectral dependence.
Weight
A total weight of snow cover constitutes an important information in terms of security risks. It can be measured using a reflective plate placed under the snow cover height sensor. At the same time, the plate can act as a weight.
Humidity
Humidity sensors are located in radiation shield.
SHT25V01A - sensor with I²C output and optional self-testing by heating of the measuring element.
Sensor time constant is approximately 3s, a satisfactory recorded data sampling is therefore less than 10s.
Common difficulties
- Gradual degradation of the measuring element
- Damage to sensor
- Measuring element saturation and time-lagging during vater evaporation.
Self-test in pseudorandom time serves as a diagnostic tool.
Temperature
Measuring the temperature of the air, although being one of the most important function of the station, is in some cases performed incorrectly - e.g. by letting the Sun influence the value. A solution to this problem is so-called radiation shield, which prevents the effect of radiation on the sensor.
Apart from commonly used DS18B20 sensor, a more modern option exists as well - LTS01A
Pressure
Magnetometer
Cloud cover
Coverage
MRAKOMĚR 4 - “cloud meter”
Height (ceilometer)
A laser ceilometer can be built from already existing modules.
Radiometer (sunshine measurement)
Luminous flux
Use of a photovoltaic cell, measuring output in W/m².
UV index
Measuring the UV index to determine safe exposure (similar to UV dozimeter). ISL02A module can also be used.
Light intensity
Possible to measure with ISL2902001A sensor.
Ionization detector
Measuring the intensity of ionizing radiation with GM or semiconductor detector.
Infrasound detector
Sound level meter
Limnimeter
Measurement of water level and flow.
Chemical sensors
- Gas detection CO, CO2, N2… H2S, CH4.. AFE Sensor
- PH-meter
Communication interface
The weather station has several possibilities for interfaces to connect and communicate with other devices.
RS232/RS485
Modules RS232SINGLE01A or TTLRS48501A with microcontroller are suitable to establish a connection depending on the application complexity.
Ethernet
Wifi router
One of the most universal methods of connecting the station is to use a router with OpenWrt OS. It enables the use of both, ethernet and Wifi and even other interfaces in the form of modems, which can also connect to router via USB.
The weather station communicates with router via I2C bus. The bus can either lead directly form the router or through I²C to USB connector.
ARM modul
With an advantage of lower power consumption and simpler design a module fitted with ARM STM32F10xRxT01A and ethernet module ETH01A can also serve as a communication interface.
USB
I²C master
In this case, the entire device acts as I²C to USB converter, with reading from individual sensors implemented by program running at USB HOST device. The advantage of this design lies in possibility of obtaining relatively precise information about an absolute time in which the values were measured. Furthermore, changes in software and configuration can be done simply by updating the control program without a risky firmware replacement.
Emulated COM port
The weather station is connected via USBRS23201B, which creates a virtual RS232 interface.
Wireless
Wifi
See the use of wifi router with OpenWRT.
GSM
GSM01A module is suitable to transfer data via GSM or 3G/4G.
ISM band
ISM represents an industrial, scientific and medical band where license for data transfer is not required. MLAB already contains several modules enabling the use of this band.
- RFM01SMD01A
- RFM02SMD01A
- RX433MHz01A
- TXsaw433MHz01A
- ZIGBEE01A
Reading of the measured values
This design offers a possibility of connecting variety of sensors, which are initialised at every station startup. It uses I²C bus with I2CHUB02A module and predefined set of sensors.
Software instalation
Probably currently the best method is a direct reading of sensors from a master system via I²C as there exist quite a lot of old unused wifi routers able to connect I²C directly.
Lukáš Mičan from Robozor club has programmed handler program, which periodically reads the weather station sensors and sends the data to OpenWeathermap.org.
The program is written in Python and uses pymlab library to read I²C sensors.
Power supply
- autonomous power source, e.g. photovoltaic panel
- local power grid
Auto diagnostics
Still necessary to implement algorithms controlling mutual correlations of measured values and to detect anomalies.
- Wind direction can not change without speed indication from anemometer.
Considered failures
Random mechanical destruction
Involves failures that may arise from defect material or its fatigue due to environmental effects (involving UV radiation, temperature cycles,…)
Anemometer
Damage to anemometer can involve breaking off one or more blades or rotor. These events should be detected by measuring an uneven speed during one revolution
Fake outupt
Relates to following sensors:
- Anemometer - seizing up
- Wind direction - breaking off the vane
- Precipitation - clogging
Degradation
Relates to the sensors measuring:
- temperature
- relative humidity
Power failure
Causes:
- Data loss during failure
Output data format
Ideal output data should be compatible with one of the already used meteorological data protocols:
- NMEA
- RMYT?
- Direct reading I²C
Data output should also include accurate time record of measurement - time information can be obtained via GPS01A. In order to integrate the station into more complex project its output should support more bus systems (USB, CAN, RS232, RS485, Ethernet).
Data recording
Data measured by weather station should be recorded and displayed locally. That is why a program serving the weather station should run either on local computer or directly on weather station processor. In the latter case, the weather station would probably run a web server as well, which could provide local data previews and send them to collecting network.
The following list contains some of the most widespread Open-Source programs for local data recording and processing.
Our ideal program should be multi-platform with minimal operating requirements and with possibility of sending data to one of the global network of weather stations. The data should be, at the same time, locally backed up and they should be able to combine with data from other stations. Examples of such database include: DB-All.e or NetCDF.
Examples of use
- Weather station of unmanned aircraft ground control station
Automatic weather station AWS01A
Sensors
Temperature
Measured by DS18B20 sensor.
Pressure
Measured by ALTIMET01A module with MPL115A1 sensor.
Humidity
To measure a relative humidity and air temperature we use a SHT11 sensor soldered into universal PCB and SHT25 sensor in SHT25v01A module.
Anemometer
Reading is carried out by two timers - one (timer1) is clocked by a crystal and second (timer0) counts the impulses.
Data output
# AWS01A 0.1 (C) 2013 www.mlab.cz
# ver seq  temp[K] hum_temp[K] hum[%] bar_temp[K] pressure[hPa] anemo[m/s] check

$AWS0.1 0 29271 29390 64.3 29416 959.4 6.0 *5C
$AWS0.1 1 29271 29390 64.3 29416 961.1 6.3 *53
$AWS0.1 2 29277 29389 64.3 29416 960.7 7.0 *59
Meaning of the variables is as follows:
- ver denotes the device and firmware version
- seq is the serial number of a measurement
- temp[K] denotes the temperature measured thermometer (in hundredths of Kelvin)
- hum_temp[K] - temperature from 1st humidity sensor
- hum[%] - relative humidity measured by 1st humidity sensor
- bar_temp[K] - a very inaccurate barometer temperature (interesting rather in the case of eventual relative temperature compensation)
- pressure[hPa] - pressure measured by barometer
- anemo[m/s] - wind speed measured by anemometer
- check - a checksum (same as NMEA format)
Firmware update
The firmware can be updated without any special utility only by sending HEX file with firmware to serial link of processor when it expects the firmware and writes:
uf?uf?
This condition occurs after resetting the device.
Following that, a new firmware can be send using a command listed below (either under root account or under account with access to the serial line)
$ echo uf > /dev/ttyUSB0
ascii-xfr -s -v -l 110 ./firmware.hex > /dev/ttyUSB0
Ascii-xfr program is a part of minicom package in Ubuntu. In order to monitor the data recording, it is possible to listen at the same port:
picocom /dev/ttyUSB0
Weather Station Application
- BART Ondřejov
- D50 telescope (Ondřejov)
Referencies
- MMA Weather Station - Related project with almost the same ideas.
en/aws.txt · Last modified: 2015/03/05 22:49 (external edit)